Look at this map, and notice that deep, deep in the Republican South, there's a thin blue band stretching from the Carolinas through Georgia, Alabama and Mississippi. These are the counties that went for Obama in the last election. A blue crescent in a sea of red.

These same counties went mostly blue in 2004 and 2000. Why? Well, the best answer, says marine biologist Craig McClain, may be an old one, going back before the Civil War, before 1776, before Columbus, back more than 100 million years to the days when the Deep South was under water. Those counties, as he writes here, went for Obama because trillions and trillions and trillions of teeny sun-loving creatures died there. He's talking about plankton. That's why the Republicans can't carry those counties. Blame plankton.
[Don't leave. I know some of you bounced here because my headline was political, and the word "plankton" will send you scuttling back to HuffPo, Politico and Drudge, where politics is plankton-free. But before you go, check out this next map.]
It's an image of North America as it looked during the Cretaceous era, 129 million to 65 million years ago. As you can see, much of the continent was still covered by water. The Deep South had a shoreline that curled through the Carolinas, Georgia, Alabama and Mississippi, and there, in the shallow waters just offshore, were immense populations of floating, single-celled creatures who drifted about, trapped sunshine, captured carbon, then died and sank to the sea bottom. Those creatures became long stretches of nutritious chalk. (I love chalk.)
When sea levels dropped and North America took on its modern shape, those ancient beaches — so alkaline, porous and rich with organic material — became a "black belt" of rich soil, running right through the South. You can see the Cretaceous beaches in this map, colored green. McClain got these maps from geologist Steve Dutch's website, at the University of Wisconsin, Green Bay.

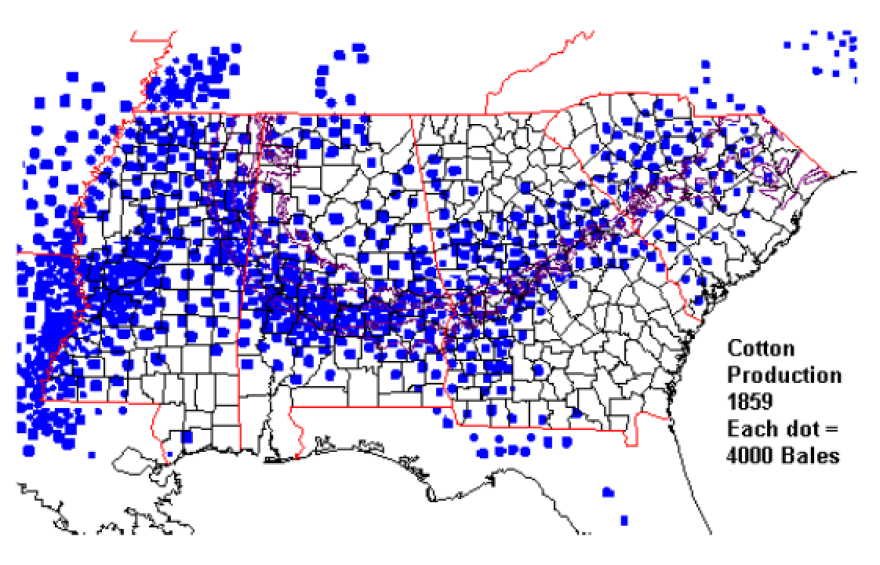
And because this stretch was so rich and fertile, when cotton farmers moved here in the 19th century, this stretch produced the most cotton per acre. Harvests of 4,000-plus bales were common here. Notice that the most productive plantations mirror the ancient coastline.

Then came slavery.
McClain, quoting from Booker T. Washington's autobiography, Up From Slavery, points out: "The part of the country possessing this thick, dark and naturally rich soil was, of course, the part of the South where the slaves were most profitable, and consequently they were taken there in the largest numbers." After the Civil War, a lot of former slaves stayed on this land, and while many migrated North, their families are still there.

In this 2000 census, you can see that the counties with the biggest populations of African-Americans still trace that Cretaceous shoreline.
This, says marine biologist McClain, explains that odd stretch of Obama blue; it's African-Americans sitting on old soil from ancient organisms that turned sunshine into fertilizer. So plankton remain a force in Southern elections — though not always, not continuously. After the Civil War, when the South voted solidly Democratic and Jim Crow laws ruled, many blacks couldn't vote, so the pattern disappears. Voting rights laws hadn't been passed during the Goldwater-Johnson election of 1964, so in this map, the African-American difference is invisible.

But some African-Americans were still there. So was the soil (though it's not as rich as it once was), and so were the rocks that geologist Steve Dutch "found immediately familiar" because they mapped those ancient shores. All of which is to say, when you cover politics, sometimes, without realizing it, you are also telling rock tales. Geology, every so often, peeks through.
Geologist Steve Dutch's detailed maps, and careful analysis, come from a study he did of the Bush-Gore election in 2000. He called it "Geology and Election 2000." You can find that here. "Dr. M" (that's Craig McClain's Nom de Blog at "Deep Sea News") wrote his geology analysis here.
Copyright 2021 NPR. To see more, visit https://www.npr.org.


